spacetab

Drilling monitoring for LUKOIL

Project completed, 2019–2022

A system for Digital Petroleum that uses live rig data to warn of drilling incidents and to show which rock the bit is cutting. Two modules — “Forecast of drilling incidents” and “Reconstruction of rock strength while drilling” — inside LUKOIL's closed network.

Client and task

Digital Petroleum builds models for oil companies that predict drilling complications and determine rock properties from mud logging data streamed from the rig in real time. For LUKOIL these models had to become a working tool for drilling engineers: every few seconds collect data from the rigs of all subsidiaries and production units, run it through the models and show the result so that a risk on a well is noticed before an incident.

Our task was to build the whole system around the models: telemetry intake over the WITSML protocol, a directory of subsidiaries, fields, well pads, wells and wellbores, storage and recalculation of results, events and alerts, reports, sign-in through the corporate directory and a web interface for both modules. All of it had to run inside the client's closed network, with no internet access.

What we built

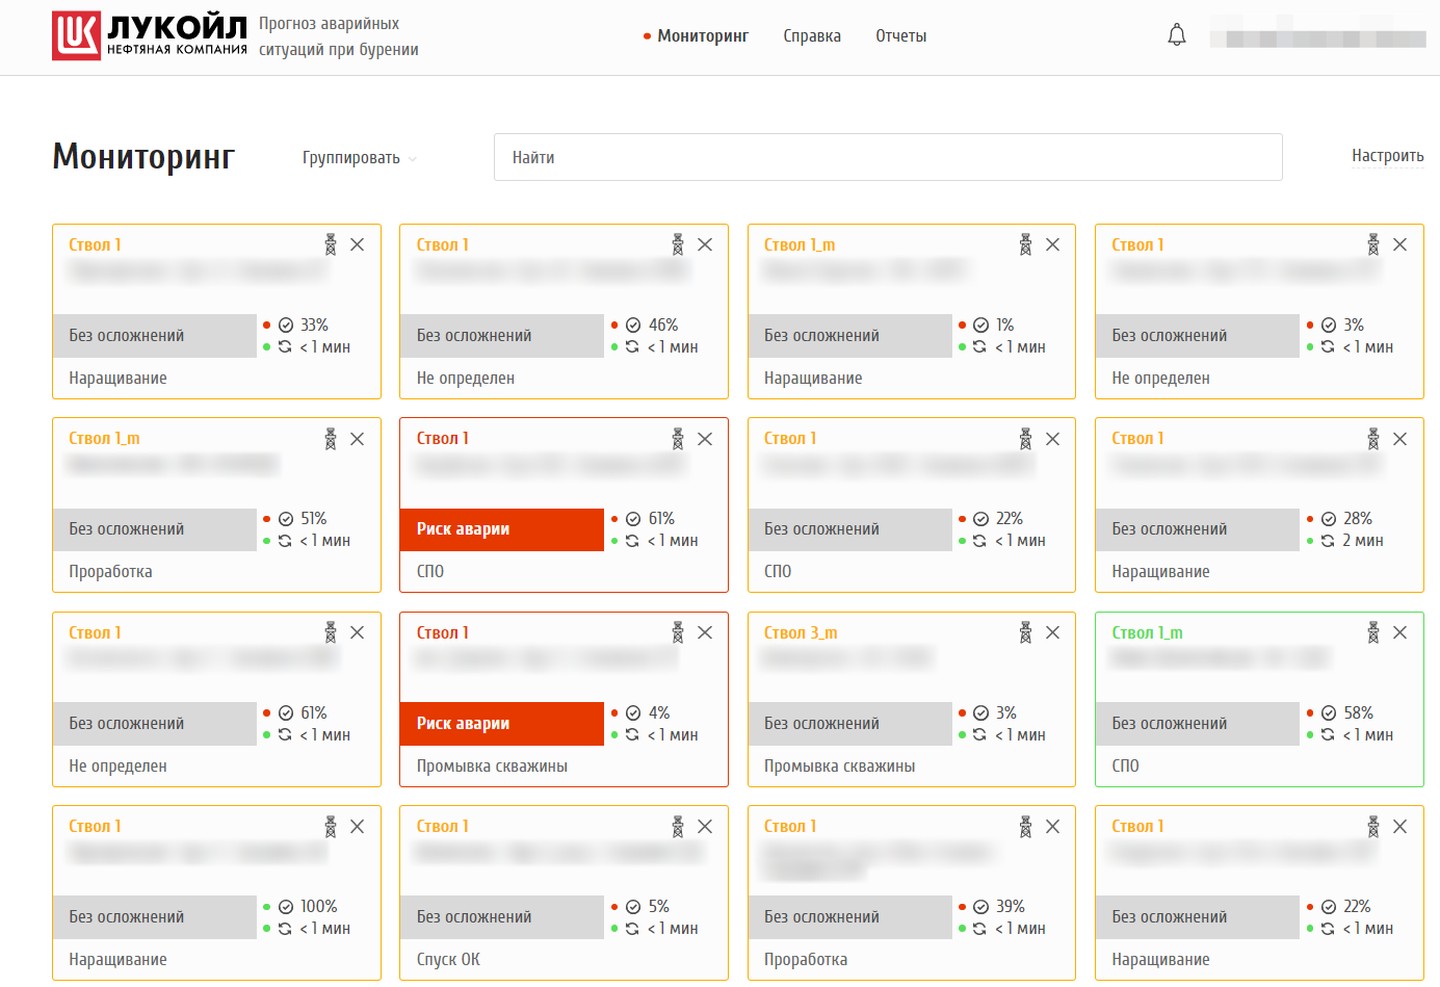
Incident forecast: monitoring with 16 wellbore cards, two at incident risk

Monitoring: every wellbore on one screen

Each wellbore has a card: field, pad and well, status (“no complications”, “possible complication”, “incident risk”), the current operation — drilling, connection, tripping, reaming — data quality and time since the last sync. The frame colour shows whether the data can be trusted. Search, grouping by status or field, updates every 10 seconds.

An engineer keeps all their wells in view and spots at once the one where risk is growing.

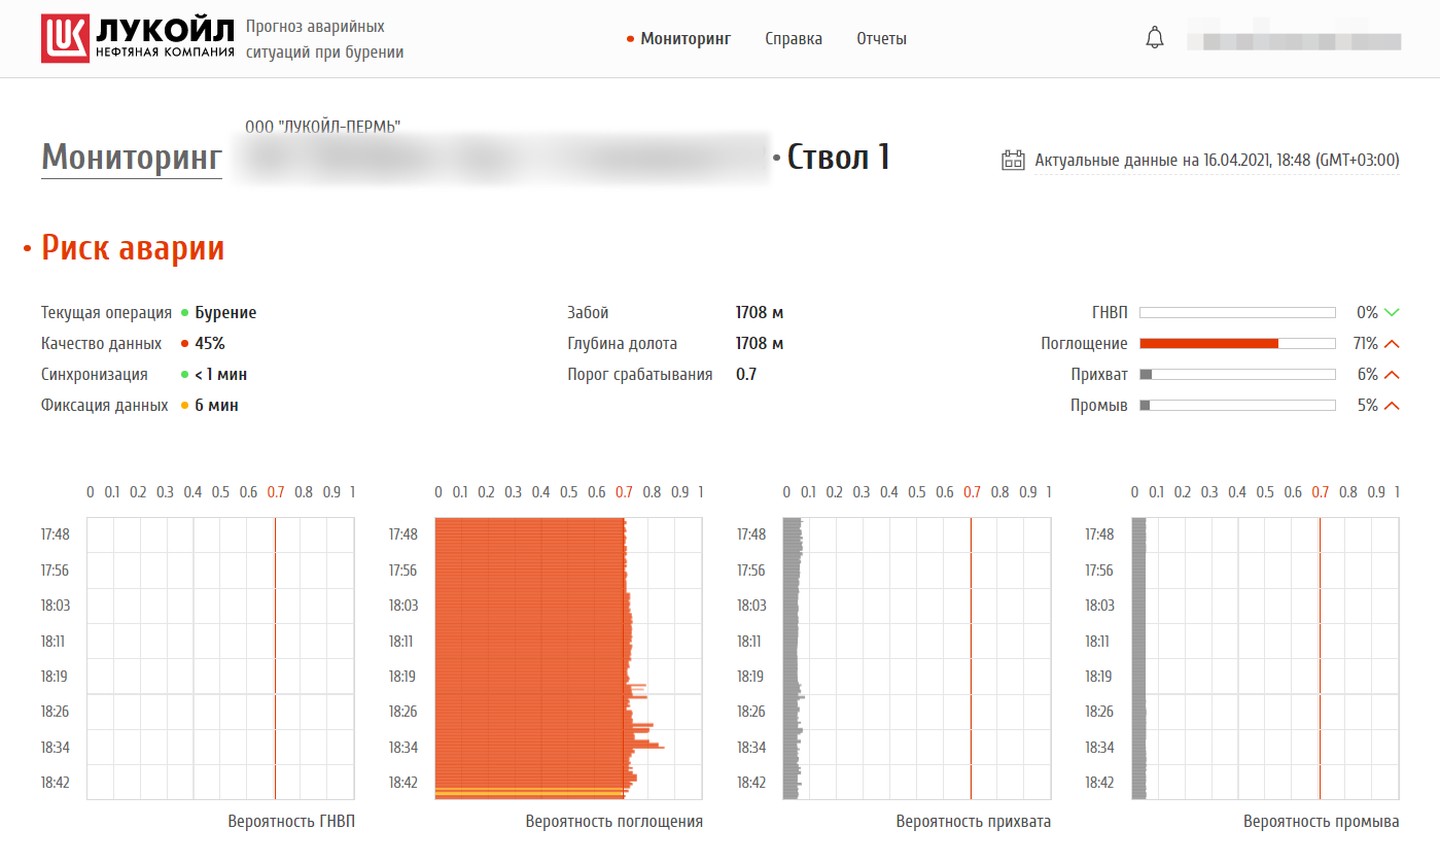
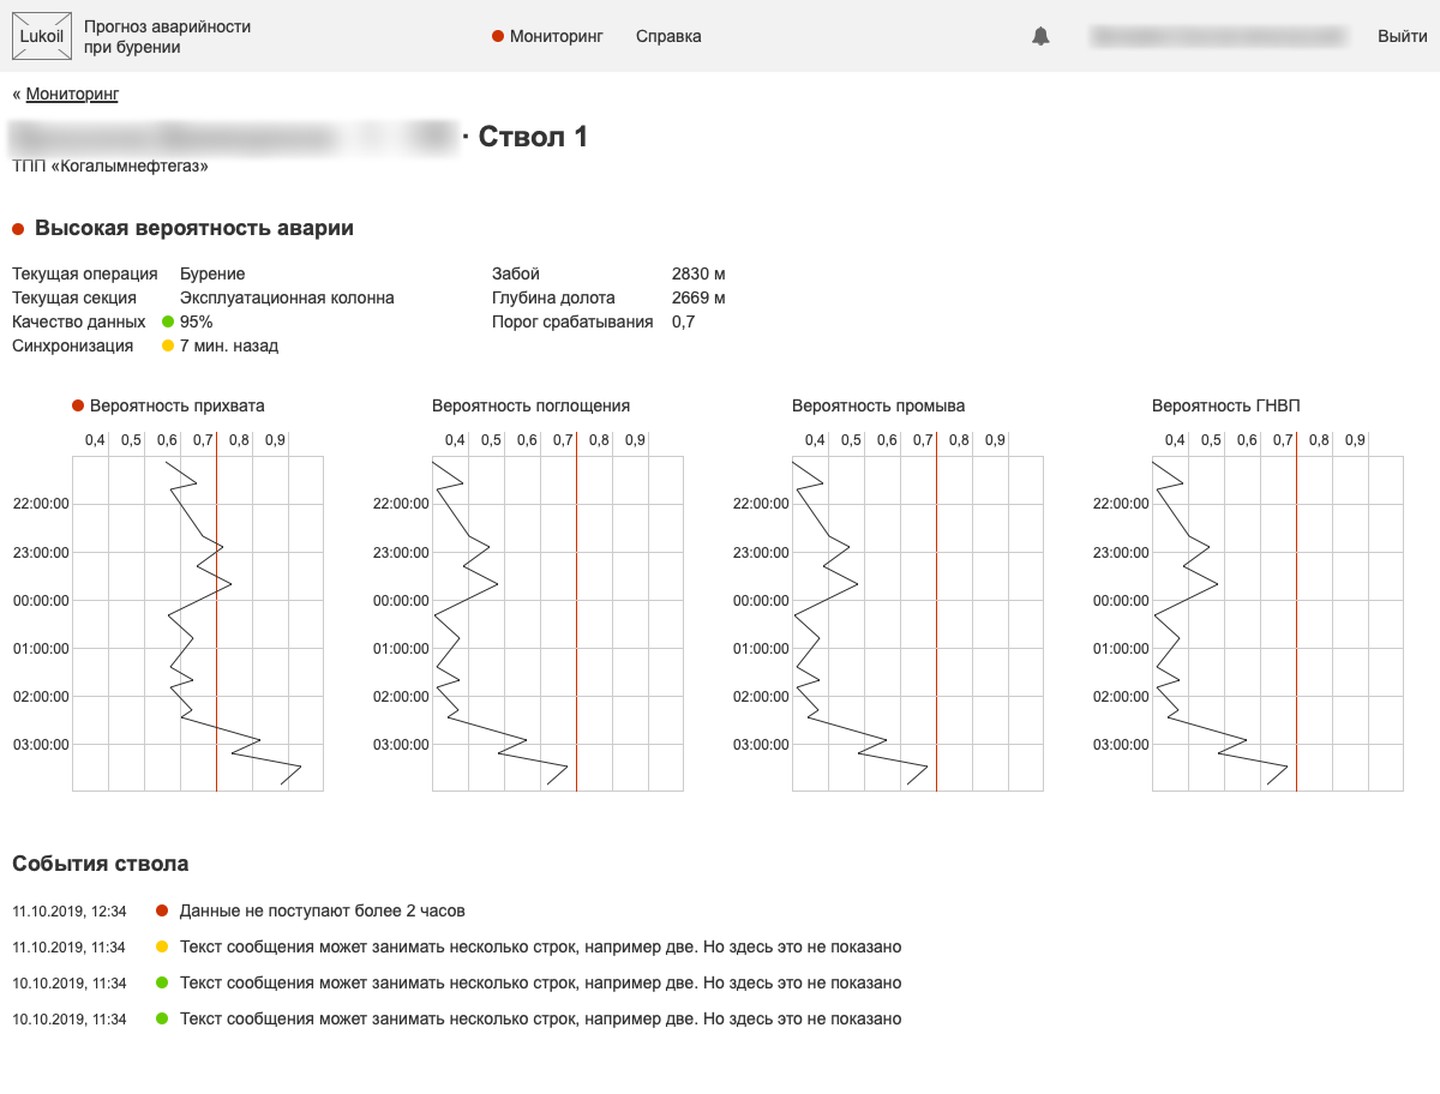
Wellbore page: incident risk, mud-loss probability above the threshold, four complication charts

Wellbore page: the probability of each complication

Gauges and time charts for kicks, mud losses, stuck pipe and washouts, with a red line for the alert threshold. Next to them — hole depth, bit depth, operation and data quality. A time switch opens the archive: the wellbore's state at any past date and hour.

You see not only that the risk is high, but which one it is and how it built up.

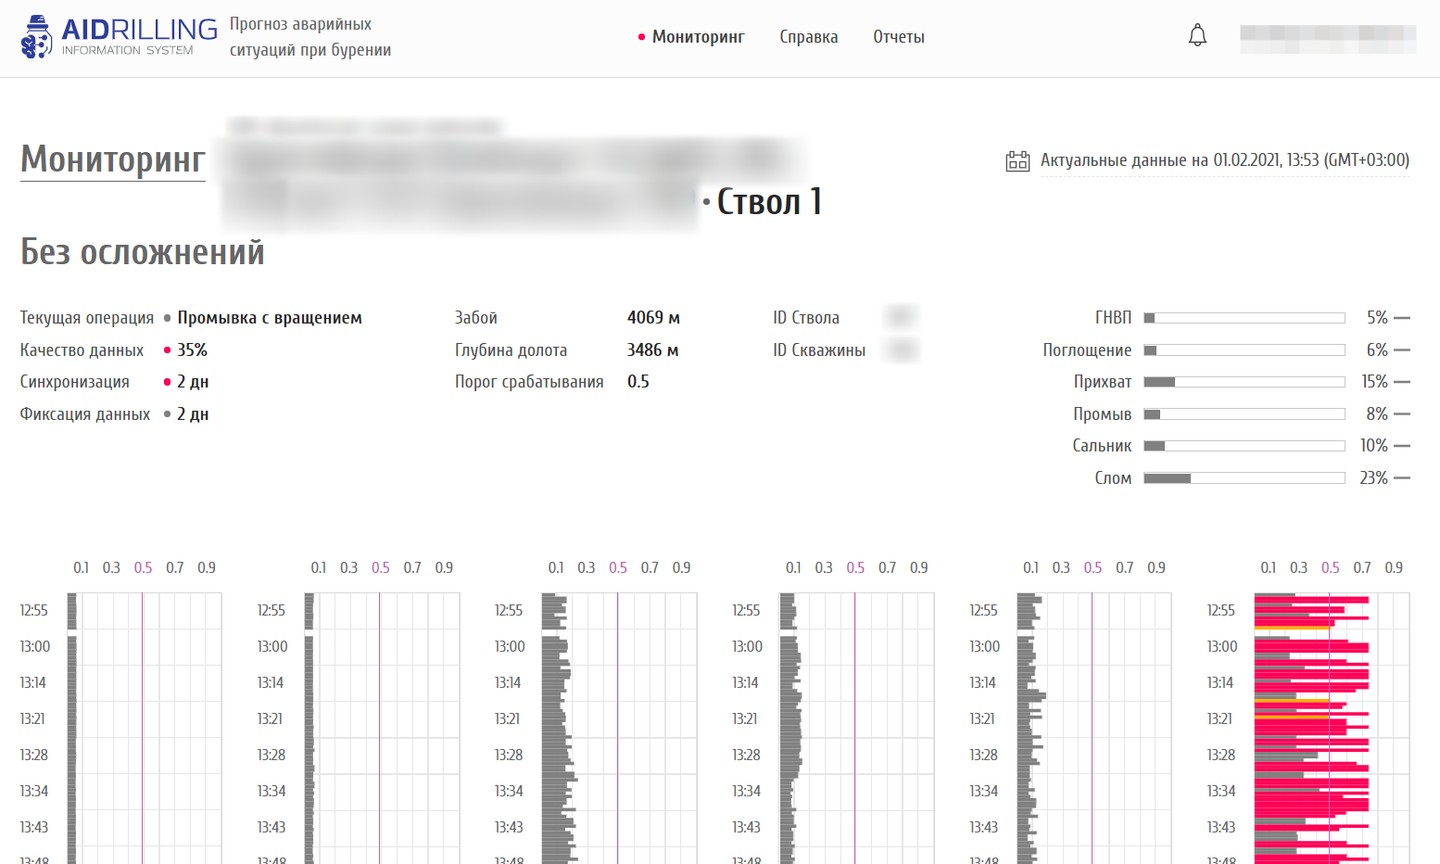
AIDRILLING version: wellbore page with six complication types

Six types of complications and a brand of its own

The AIDRILLING version adds tool failure and bit balling to the four complications. Logo, colours and contacts are set in configuration: for LUKOIL the system wears the company's style, as Digital Petroleum's own product it carries the AIDRILLING brand.

One system goes to different clients without rework.

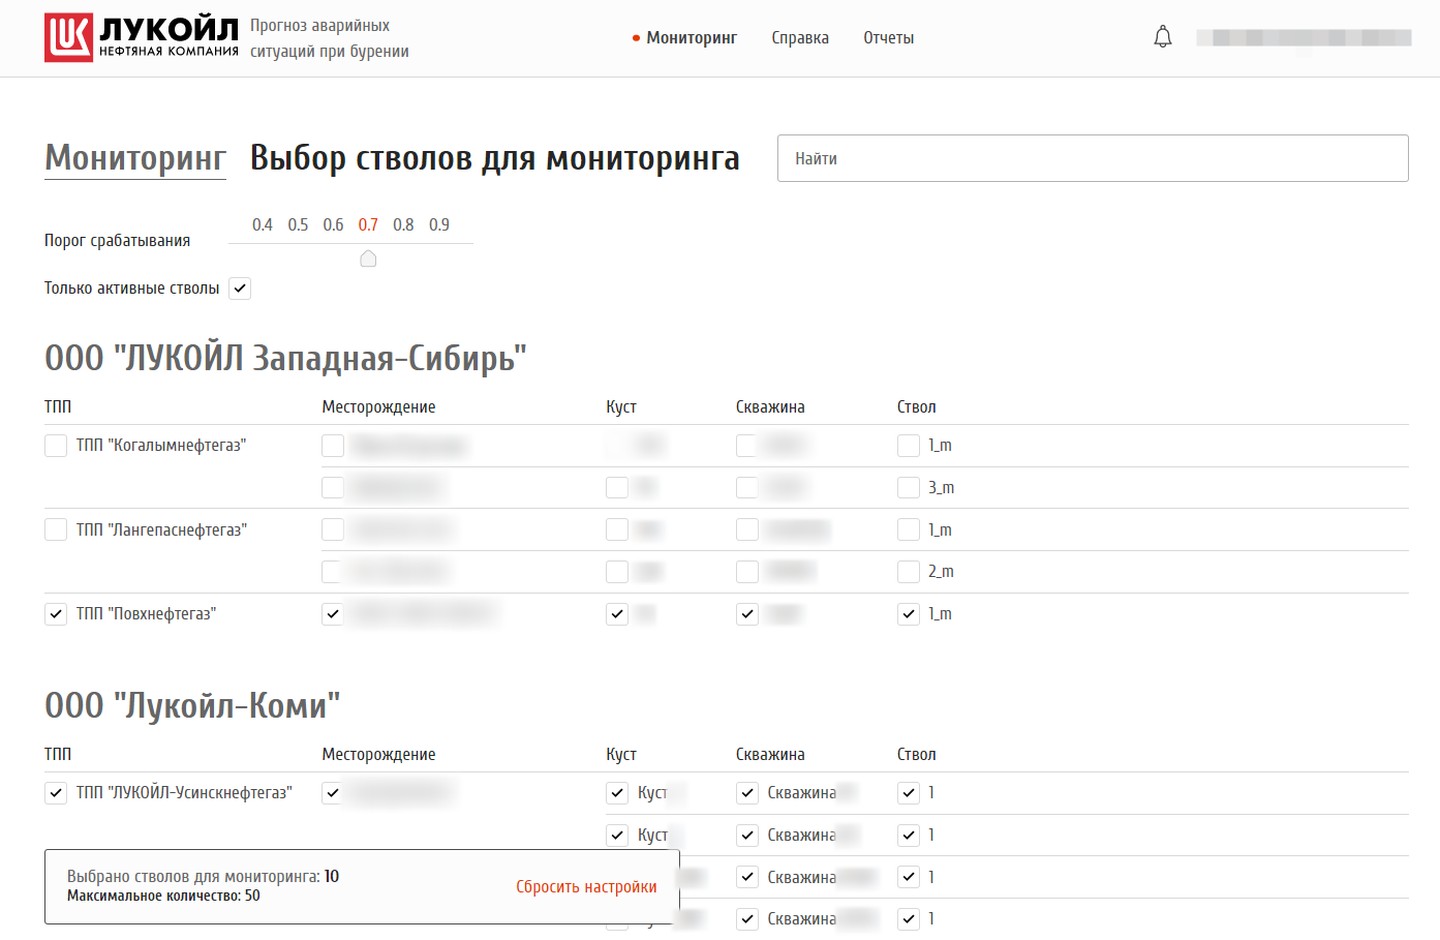
Choosing wellbores to monitor: alert threshold and the tree of units, fields and wells

Choosing wellbores and the alert threshold

A tree of available wellbores: subsidiary, production unit, field, pad, well, wellbore — with search at any level and an “Active wellbores only” checkbox. A slider from 0.4 to 0.9 sets the probability at which the system raises an alarm. Which wellbores are visible depends on user rights.

Everyone watches their own wells and chooses how sensitive the alarm should be.

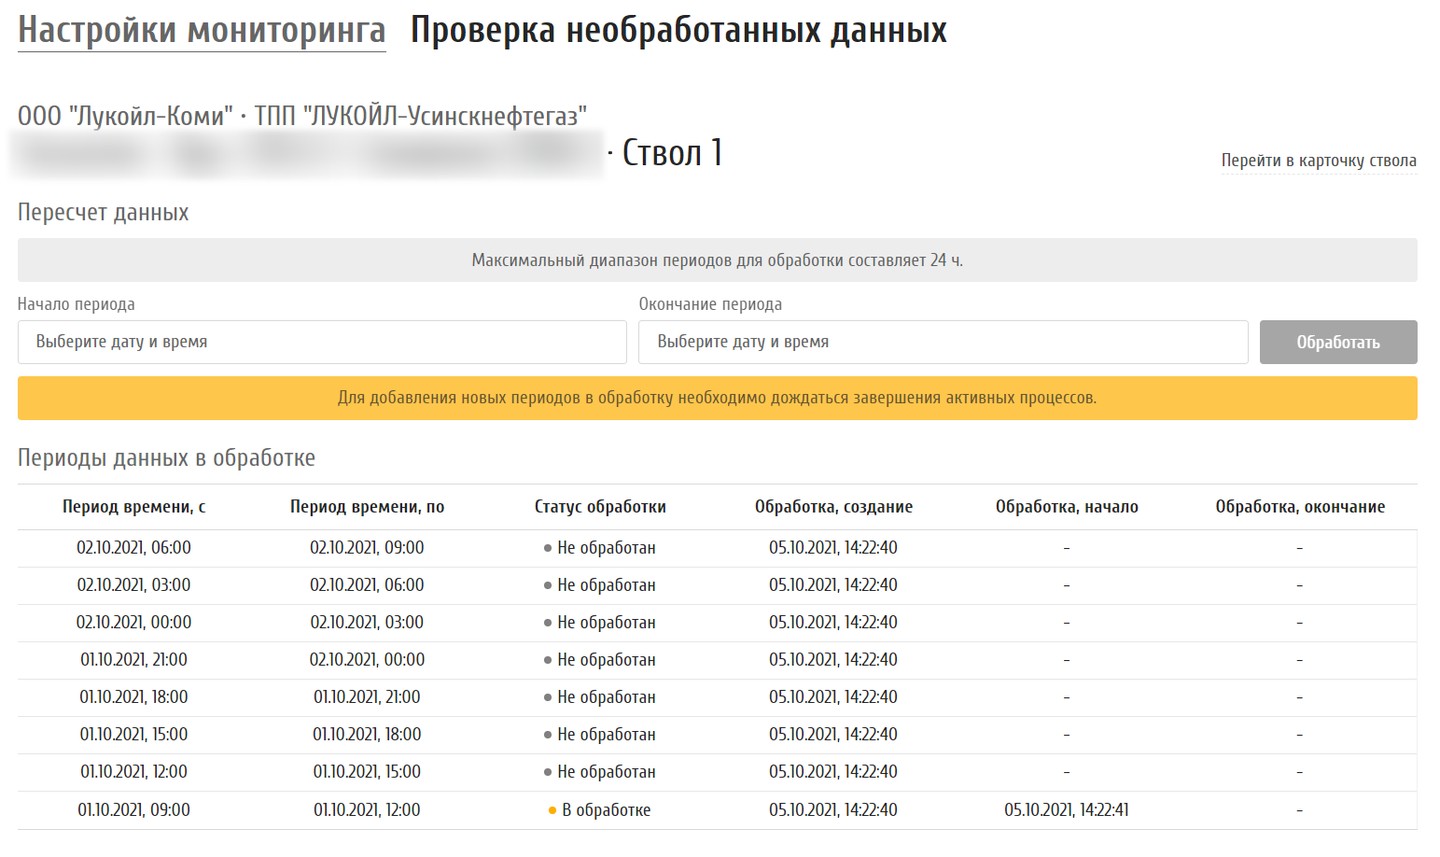
Historical data recalculation: period selection and processing status table

Recalculating historical data

If data arrived late or a forecast needs re-checking, the user picks a period of up to 24 hours and the system queues it for processing. A table shows every chunk: not processed, processing, done. Access to the section is granted through corporate directory groups.

Gaps in the forecast are closed without developers.

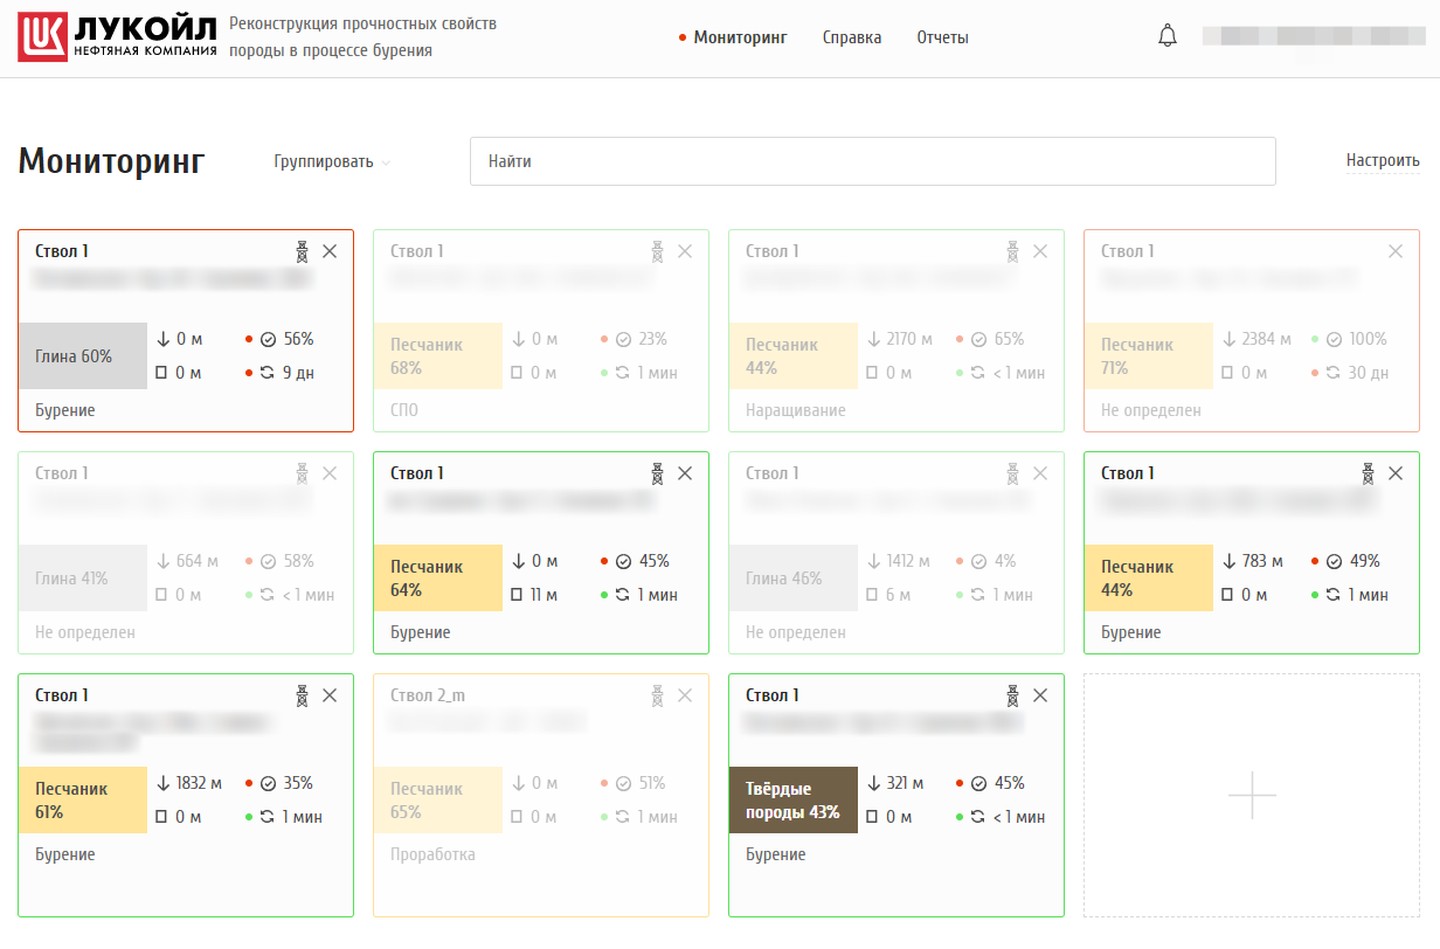
Rock reconstruction: monitoring with the most likely rock on each wellbore

Reconstruction: which rock is under the bit

The second module on the same platform. A wellbore card shows the most likely rock — clay, sandstone or hard rock — with its percentage, the depth where it was detected and the footage drilled without change. When a wellbore is not being drilled, its card fades. Grouping by rock type or field.

A change of rock shows up the moment the bit enters it.

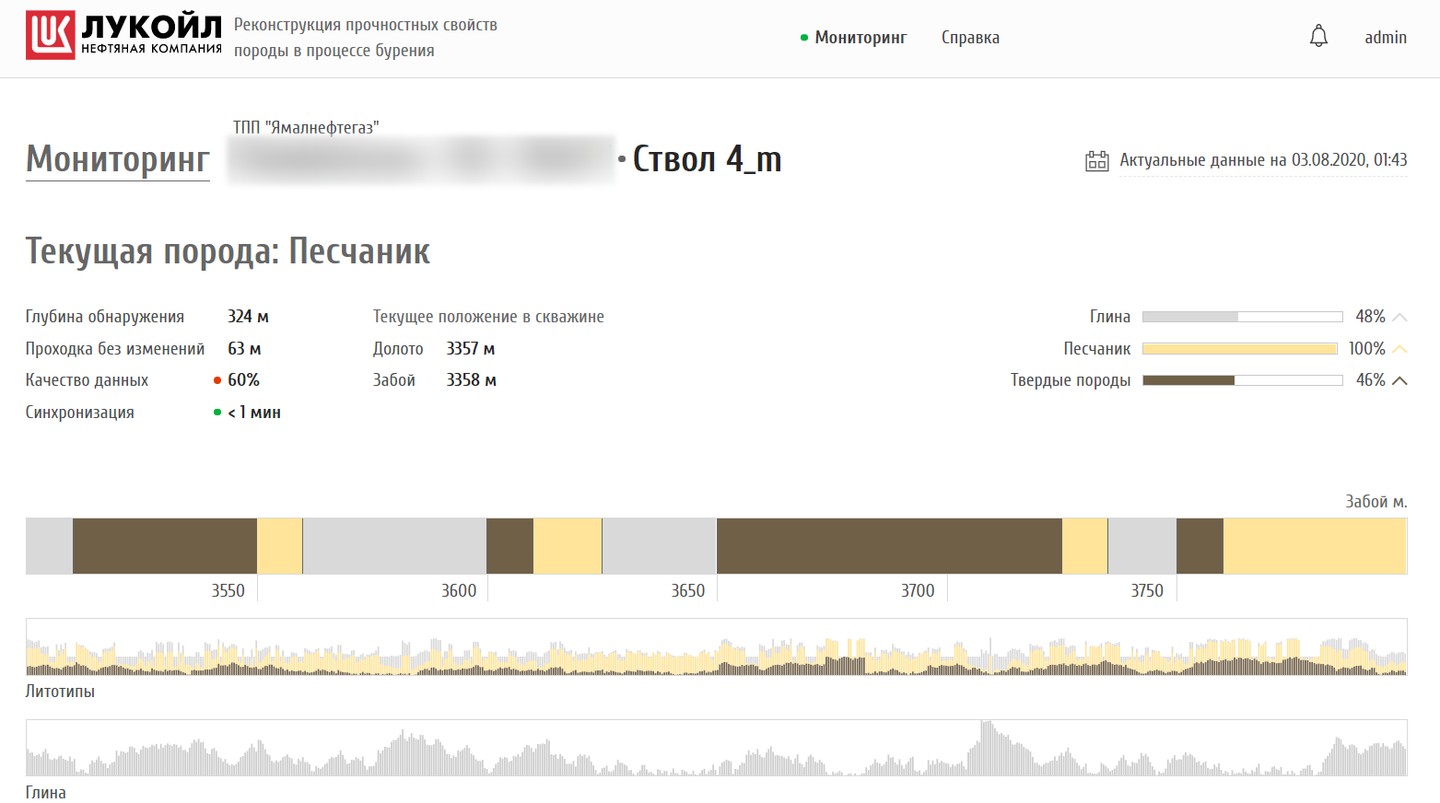
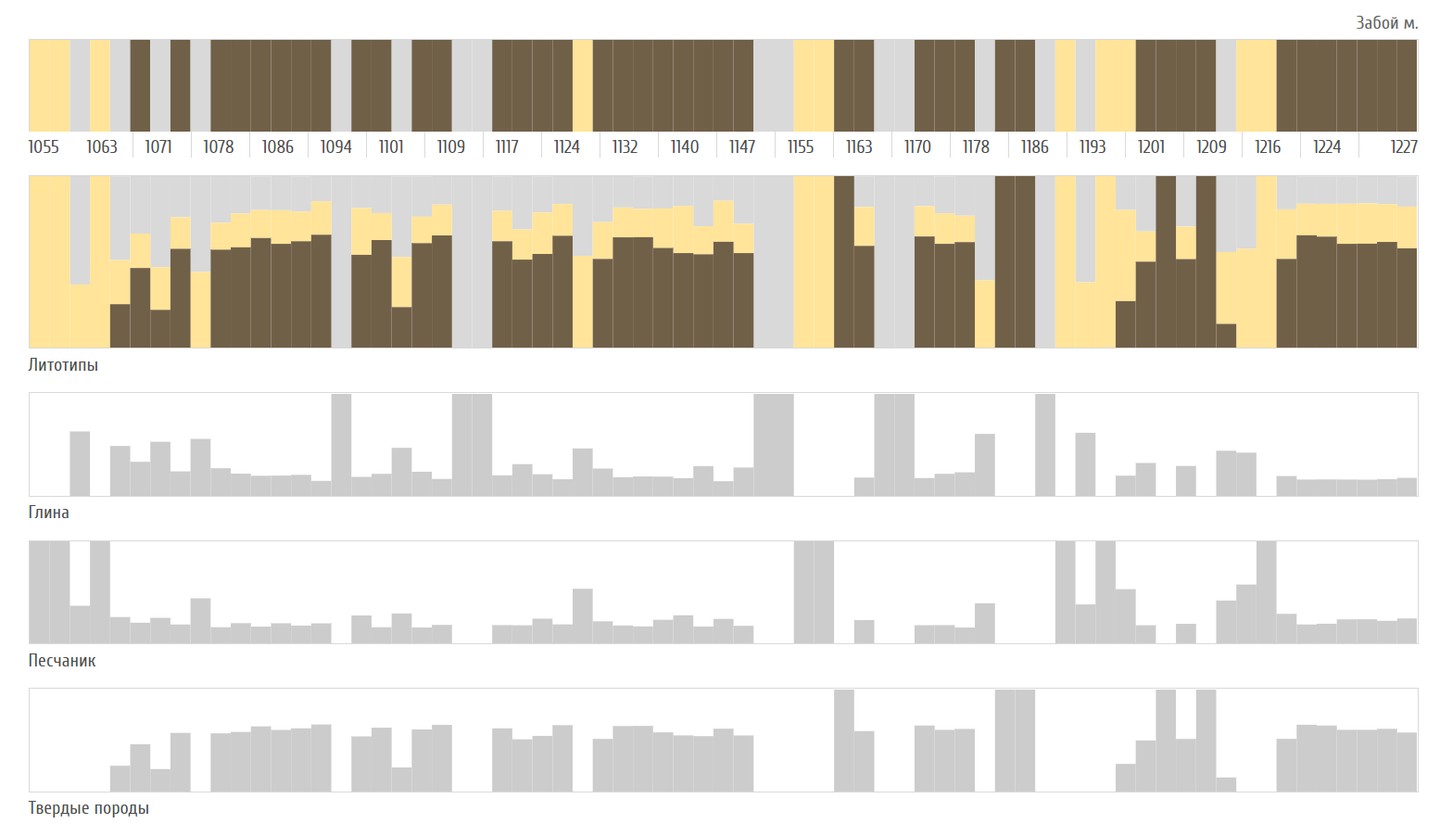
Wellbore page: current rock, class probabilities and a lithotype strip over 3,500–3,780 mLithotypes over 1055–1227 m with clay, sandstone and hard rock charts

Wellbore page: lithotypes by depth

The current rock and the probabilities of three classes, bit and hole depth, a lithotype strip along the drilled metres and separate charts for clay, sandstone and hard rock.

A rock profile of the well is built while drilling.

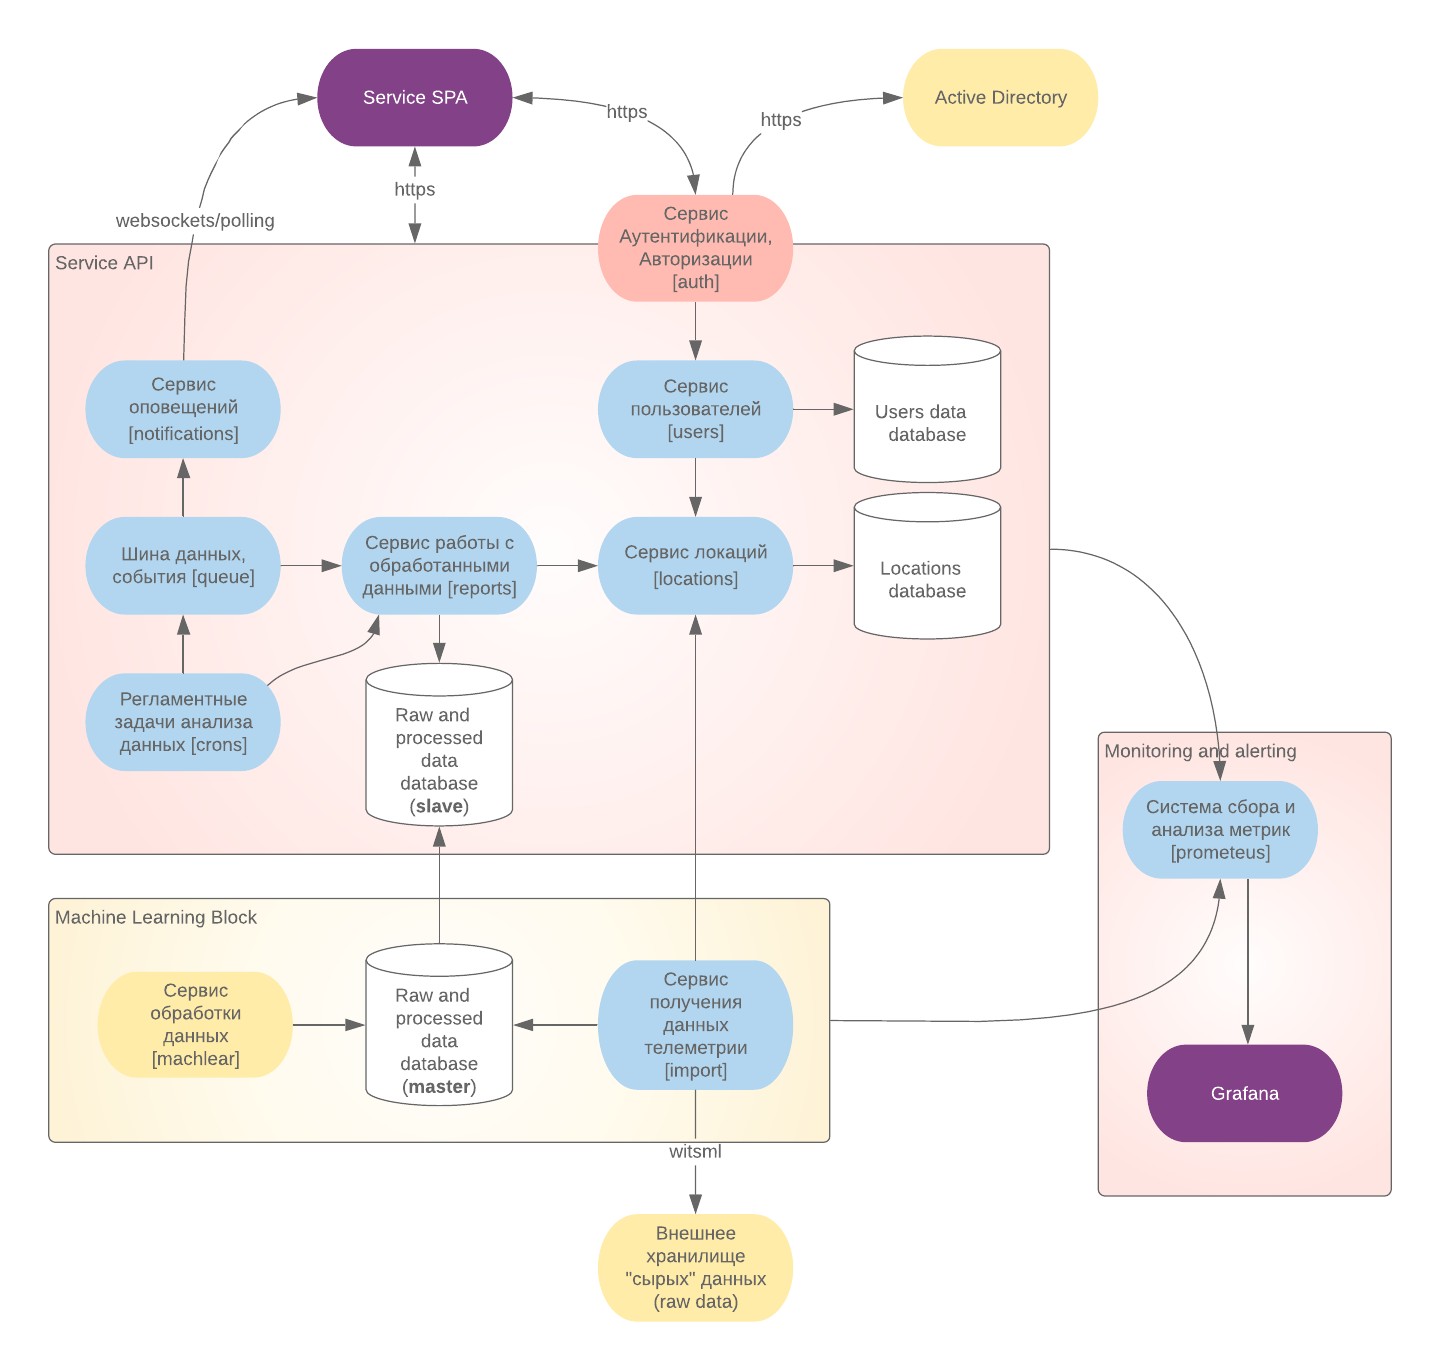
System diagram: web app, API services, model block, WITSML import, Active Directory, metrics

Working in a closed network

Sign-in through the corporate Active Directory, no registration on the site; access to sections by directory groups. The system is deployed to the client's Kubernetes without internet. The diagram shows its parts: telemetry import, the model block with its own database, data, user and alert services, and health monitoring of every service. The help has instructions on retraining the models on new data and rolling them out inside the network.

Drilling data never leaves the company network.

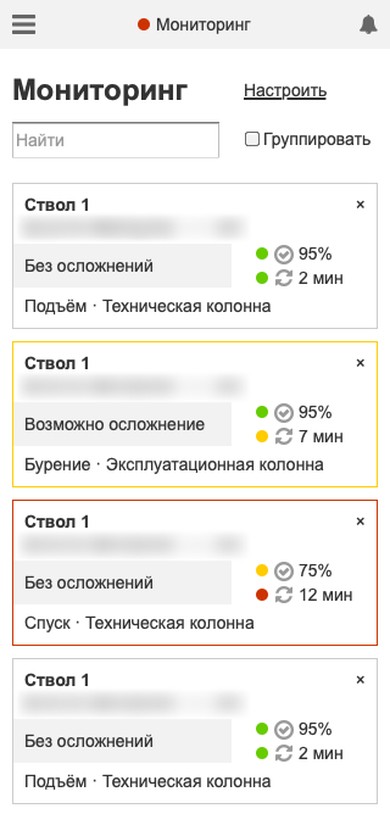
2019 prototype: wellbore page with four probability charts and events2019 prototype on a phone: monitoring with wellbore cards

A prototype before development

In autumn 2019, before the contract, we built a clickable prototype of the forecast module: sign-in, monitoring with grouping and search, wellbore selection, a wellbore page with probability charts, events and help — for desktop and phone, with notes on every state of a card.

The client saw how the system would work before development began.

1 / 9
  • Events and alerts

    The bell in the header collects events for the chosen wellbores: high probability of a complication, lithotype change, no data for 5 or 15 minutes, drilling finished. The same events arrive by email, and every wellbore has its own event feed.

    People learn about a risk even when they are not looking at the screen.

  • Reports and activity log

    A report on chosen wellbores for a period and a report on user actions — sign-ins, changes to the well list and the alert threshold — download as files.

    Managers see how drilling goes and how the system is used.

  • Built-in help

    For each module — articles on every screen with illustrations, from sign-in to reports. New articles are added as files without changing the interface.

    A new user does not need a separate training course.

How it works

Every 10 seconds the import service pulls rig telemetry over WITSML, and the well directory from the client's engineering databases, and passes the data to a shared message bus. The service with Digital Petroleum's models computes complication probabilities and lithotypes from the telemetry; the results are stored, served to the web application and turned into events for alerts. For testing without a rig we built a generator that behaves like a real well and streams data over WITSML.

Timeline and scale

  1. October 2019 a clickable prototype of the forecast module for desktop and phone.
  2. March 2020 the contract for both systems and the start of development: the web interface, monitoring, the wellbore page, settings.
  3. April – July 2020 data services: WITSML import, the well directory, corporate directory sign-in, model integration, the WITSML generator, results storage, the activity log, notifications and help.
  4. August – November 2020 deployment to the client's Kubernetes, email alerts, wellbore reports, load tests.
  5. December 2020 the last of 17 stages accepted: both systems and their documentation.
  6. From October 2020 support and development: historical data recalculation and user activity reports were added in 2021.
  7. April 2022 load testing for LUKOIL and the last changes.

Scale: 19 repositories and about 3,700 commits — the web application, twelve services and a shared library, the model service, a test user directory, deployment charts and API documentation. Each system was handed over with about twenty documents: a technical description, user and administrator guides, a model retraining guide, a test programme, operating procedures and service level agreements. In load tests in November 2020 the forecast handled data from 22 wells drilling at once and the reconstruction from 20; the way from the WITSML server to a finished result took 22 and 20 seconds on average.

What it gave

  • Risk is visible before an incident

    The probability of each complication is recalculated from fresh telemetry: in tests a forecast was ready 22 seconds on average after the data reached the WITSML server. The card changes status when the forecast crosses the threshold.

  • All rigs on one screen

    An engineer watches wellbores of different subsidiaries and production units at once instead of opening each well separately.

  • Two modules on one platform

    Incident forecasting and rock reconstruction share data services, sign-in, events and reports.

  • Runs inside the client's network

    No internet, sign-in through the corporate directory, models retrained on site.

  • Handed over with documentation

    Each system comes with guides, operating procedures, a test programme and service level agreements: operation does not depend on the developers.

  • A product, not a one-off build

    Brand and set of sections change in configuration, so the system can go to other clients.

Technologies

Status

Project completed. We worked on it in 2019–2022: from a prototype in autumn 2019 to supporting the system inside LUKOIL's closed network, the last changes date from April 2022.

Vous avez un projet similaire ?

Parlez-nous-en : nous répondons dans un délai d’un jour ouvré et proposons par où commencer.

Telegram: @spacetab_bot · E-mail: bip@spacetab.io