


HYDRONOM® — satellite data on water bodies
Project completed, 2018–2023
A subscription service for anglers, spearfishers and divers: water clarity and temperature, phytoplankton, ice and weather for any water body on Earth. On the web and in a mobile app.
Client and task
Hydronom was launching a service for people who choose where and when to fish or dive. Spearfishers spend trip after trip looking for an answer to one question: “where is the water clear?”. The answer is in satellite imagery, but it has to be downloaded, processed, cleared of clouds and shown on a map in a way an angler, not a scientist, can read. We were asked to develop algorithms that determine water clarity, chlorophyll level, ice conditions, water temperature and wave height from satellite images. The service also needed storage for terabytes of data covering several years, a website with a user account, an iOS and Android app, and subscription payments.
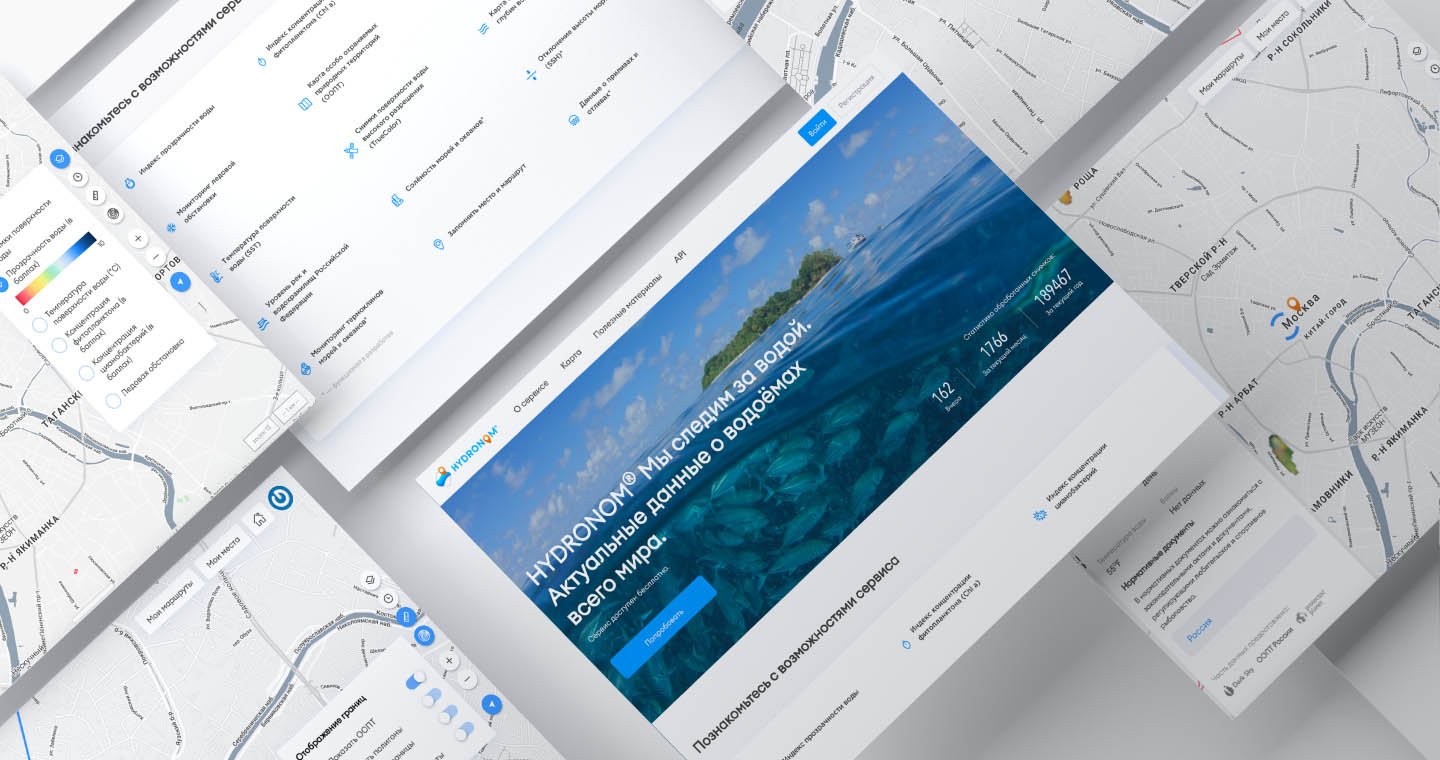
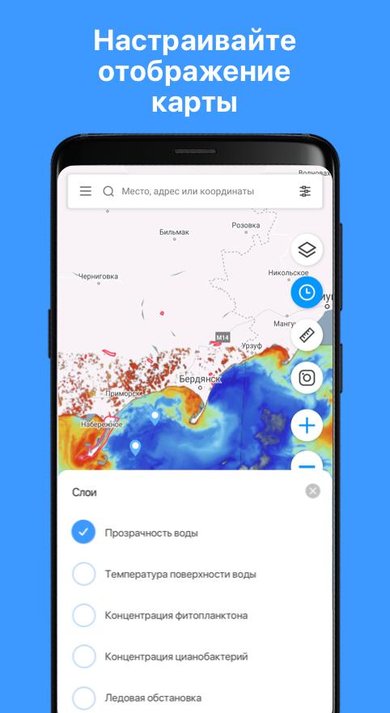
What we built
Image processing algorithms
From Landsat-8, Sentinel-2, Sentinel-3 and Aqua data the service calculates a water clarity index, phytoplankton and cyanobacteria concentration, sea surface temperature, wave height and ice conditions. New types of processing plug into the same system.
An angler sees on the map where the water is clear, warm or blooming before setting off.
Cloud removal
A dedicated algorithm cuts clouds out of an image so that at least the clear part of the frame can be used.
Even a cloudy day yields useful data.
Parallel processing and terabyte-scale storage
Each new image is processed as a separate job, in parallel with the others. Several years of data are kept for statistics, and map layers are served as cached tiles.
Images don't queue up behind each other, and a map with years of archive opens fast.
Weather and useful layers on one map
Weather and forecast, sunrise and sunset, moon phase, boundaries of nature reserves and other protected areas, river and reservoir levels in Russia, high-resolution images of the water surface.
Everything needed to plan a trip, in one window.
A website with a user account
The website mirrors the app: map layers, saved places and routes, comments on any point. Sign-in by email or with VK, Google and Facebook. The materials section holds regulations on recreational and sport fishing in different countries.
A trip is planned at the computer, and the same places open on the phone at the shore.
A mobile app for iOS and Android
Layers with a legend, point details with weather, saved places. Later the mobile app was moved from React Native to Flutter.
Water data is at hand right at the shore.
Auto-renewing subscription
Payment on the website with recurring payments.
Subscribers don't have to renew access manually.
API for businesses
Data by coordinates (layers, weather, protected areas, gauging stations) with a token, rate limits and documentation.
The service's data can be embedded in partners' products.
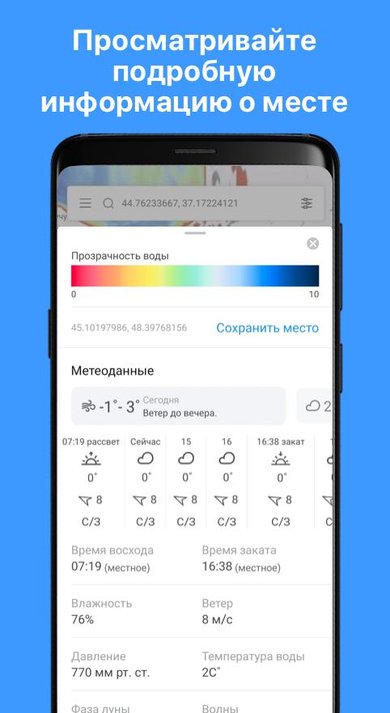
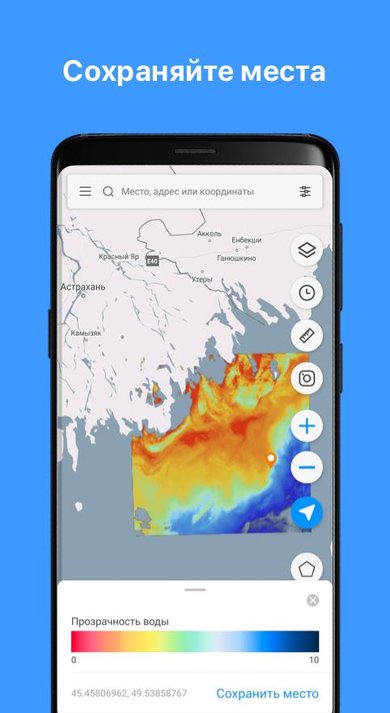
How it works
The service finds and downloads new satellite images on its own and sends each one for processing as a separate job in the cluster, so images are processed in parallel. The output becomes map layers: they are cut into tiles and cached so the map opens fast even over an archive spanning several years. The website, the app and the API all read from the same source.
Timeline and scale
- January 2018 kick-off: the first algorithms for downloading and processing images.
- September 2018 work on the website and the service API begins.
- 2019 React Native mobile app, admin panel, experiments with new data: salinity, currents, sea surface height.
- 2020 the service opens to users: the hydronom.fish website and the app in Google Play. The mobile app is moved from React Native to Flutter.
- 2022–2023 the service moves to new infrastructure; latest changes in January 2023.
Scale: more than 40 repositories — processing for different satellites and data types, API, website, admin panel, two generations of the mobile app, tile cache. According to the counter on the service's website, about 216 thousand satellite images were processed in a year (August 2020).
What the client got
Satellite data in plain language
Remote sensing products turned into clarity scores and colour layers that an angler, not a scientist, can read.
Any water body on Earth
The service isn't tied to a region: it processes imagery of the whole world, and new data types are added without redesigning the system.
Three ways to get the data from one system
Website and app for subscribers, API for business clients, all on the same data.
Technologies
Status
The service is closed. Development: 2018–2023, in operation since 2020.
Have a similar task?
Tell us about it: we reply within one business day and suggest where to start.
Telegram: @smgladkovskiy · Email: bip@spacetab.io